Texas Population Density
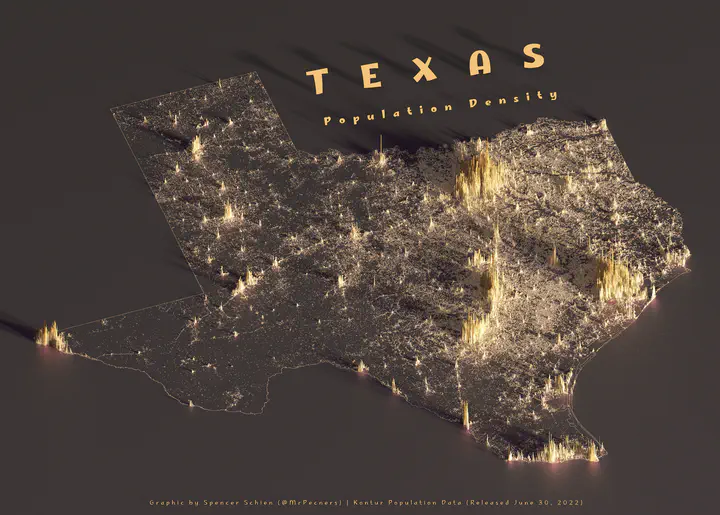
The app below contains two interactive map windows. The left window shows the population density encoded to 3D hexagons, similar to the static image above. You can drag the map to move it, and hold shift while you drag to rotate.
The right window will show the location of the hexagon you click on. You can use this to see exactly where those peaks are located.
All data is from Kontur, read about the data and their methodology here.