LaTeX Tips Part II
Introduction
This post is a follow-up to a previous post on LaTeX tricks I’ve found useful when creating R Markdown PDF Documents (see other post here). This post has fewer tricks, but they are a bit more advanced and require additional explanation.
For ease of use, here’s a list of techniques included in the post:
- Wrapping text around a figure
- Customize header text
- Use YAML variable in header
- Link YAML variable to params
- Use params to iterate report creation
A Quick Note on Pandoc
R Markdown documents use Pandoc to convert Markdown text to LaTeX (or HTML, etc.). There are intermediary documents that guide this conversion, but these documents are used in the background where the user doesn’t interact with them. The tips included in this post reach into that background to modify those documents (i.e. as we’ll see with template.tex).
If you’d like to learn more about Pandoc yourself, you can review the documentation here.
The Tips
Wrapping text around a figure
Wrapping text around a plot created in an R code chunk can be done without too much effort, but you have to know a couple things to get set up correctly.
When an R Markdown file is compiled, it creates separate documents for the plots in temporary folders. Once you know the naming structure of these files, you can reference them to exert greater control over the placement of figures.
- The top level folder will be
{YourFileName}_files- For a report titled ‘Report’, the folder will be named
Report_files
- For a report titled ‘Report’, the folder will be named
- The subfolder will be called
figure-latex - Within that subfolder, individual plots will be named for the code chunk name and numbered based on whether it’s the first plot created in the chunk (or second, or third, etc.)
- For instance, for the first or only plot created in a code chunk named
my_chunk, the file name will bemy_chunk-1.pdf. The second plot created in the chunk would bemy_chunk-2.pdf, etc.
- For instance, for the first or only plot created in a code chunk named
- Putting this all together, we could reference this plot with this file path:
Report_files/figure-latex/my_chunk-1.pdf
Below is an example of how this could look in an actual report. Keep in mind that the report file name is important, and the report below has the file name Report.pdf,
---
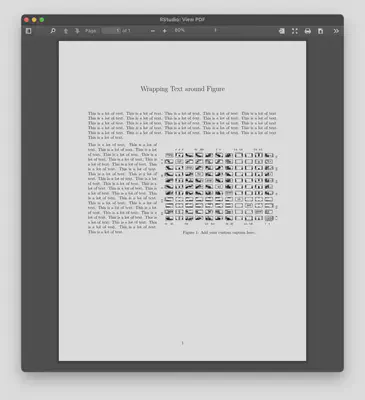
title: "Wrapping Text around a Figure"
output:
pdf_document:
extra_dependencies: ["wrapfig"]
```
```{r my_chunk, include=FALSE}
plot(mtcars)
```
This is a lot of text. This is a lot of text. This is a lot of text. This is a lot of text. This is a lot of text. This is a lot of text. This is a lot of text. This is a lot of text. This is a lot of text. This is a lot of text. This is a lot of text. This is a lot of text. This is a lot of text. This is a lot of text. This is a lot of text.
\begin{wrapfigure}{R}{4in}
\includegraphics{Report_files/figure-latex/my_chunk-1.pdf}
\caption{This is a caption.}
\end{wrapfigure}
This is a lot of text. This is a lot of text. This is a lot of text. This is a lot of text. This is a lot of text. This is a lot of text. This is a lot of text. This is a lot of text. This is a lot of text. This is a lot of text. This is a lot of text. This is a lot of text. This is a lot of text. This is a lot of text. This is a lot of text. This is a lot of text. This is a lot of text. This is a lot of text. This is a lot of text. This is a lot of text. This is a lot of text. This is a lot of text. This is a lot of text. This is a lot of text. This is a lot of text. This is a lot of text. This is a lot of text. This is a lot of text. This is a lot of text. This is a lot of text.
\begin{wrapfigure}{R}{4in}
  \includegraphics{Report_files/figure-latex/my_chunk-1.pdf}
  \caption{This is a caption.}
\end{wrapfigure}
Let’s break down what’s happening line by line:
\begin{wrapfigure}{R}{4in}is starting awrapfigureenvironment, it’s setting the figure on the right, and it’s setting the plot width to 4 inches.- You could adjust the placement of the plot and the width by playing with the last two arguments.
\includegraphics{Report_files/figure-latex/my_chunk-1.pdf}is referencing the temporary plot file described above\caption{This is a caption.}is setting the caption (this could be omitted)\end{wrapfigure}is closing out thewrapfigureenvironment
For more, view the wrapfig documentation.
Customize header text
You can change the standard header text, which defaults to section headings. If instead you want the heading to always say the same thing, you could write that header text into your LaTeX preamble.
For this to work, you do need to create a custom header file, which you will reference in your YAML.
Here’s a sample Rmd with custom header file header.tex specified in YAML:
---
title: ""
output:
  pdf_document:
    includes:
      in_header: header.tex
---

This page has a custom header.
Your header.tex need only have a few lines to accomplish this:
\usepackage{fancyhdr}
\pagestyle{fancy}
\lhead{Custom Header Text}
Use YAML variable in header
Hard-coding the header text can be a useful tool, but a more powerful technique would be to link the header text to a variable. For this to work, you’ll need to create a custom template for your report. Here’s a basic template that I use, which you should be able to copy-paste to use yourself. (I didn’t create this template myself, but I copied a template and modified it slightly. Unfortunately, I can’t find the original source to cite.)
This is actually a Pandoc template, and our YAML variables are passed as Pandoc variables to compile LaTeX documents. So, just like the title or author YAML variables, we can create our own that will be passed to our template. Then, we just need to add a reference to that variable in the template. If you look back at our previous example using header.tex, we will be replacing the hard-coded header text with a variable reference.
First, create a file called template.tex (using the example template I linked above, or your own). Then you need to reference the template in your YAML (below assumes template.tex is in the same directory as the Rmd document).
Lines 269 - 272 of the template linked above are where the header is defined. If you don’t have a logo, you can delete line 271 or comment it out like I’ve done below. Notice the last line sets the left header, and towards the end you see $applicant$. In Pandoc templates, variables are notated with a $ on either side, so here our variable name is applicant.
\usepackage{fancyhdr}
\pagestyle{fancy}
% The line below will add a logo to the right header
% \fancyhead[R]{\includegraphics[width=0.25\textwidth]{logo.png}}
\fancyhead[L]{\textbf{\fontsize{14}{14}\selectfont $applicant$}}
With the applicant variable set in our template, we need to create the variable in our YAML. Here’s what a simple Rmd could like like.
---
title: ""
applicant: Custom Variable
output:
  pdf_document:
    template: template.tex
---

This page has a custom header.
Link YAML variable to params
So that’s pretty cool, we created our own template that references a custom variable. We’re still hard-coding that variable, though, because we’re typing in the value in YAML. To bump things up another notch, let’s structure things so we can set the variable using `r params`.
We can reference `r params` in other YAML variables, as shown below. This is still using the same template.tex we used above.
---
title: ""
params:
  var: "Custom Params Variable"
applicant: "`r params$var`"
output:
  pdf_document:
    template: template.tex
---

This page has a custom header.
Use params to iterate report creation
And now, to really bring us home, let’s harness the power of parameterized reports to showcase why this is useful. Using everything from our previous example, the R script below will create three separate reports named Report 1.pdf, Report 2.pdf, and Report 3.pdf. Since we’re setting our `r params$var` value to the $ i^{th} $ element of header_data – and because `r params$var` is passed as a Pandoc variable to our template to set the header text – the header for each file will reflect the $ i^{th} $ element.
# R script that renders 3 separate reports

header_data <- c("Report 1",
                 "Report 2",
                 "Report 3")

for (i in header_data) {
  rmarkdown::render("Report.Rmd",
                    params = list(var = i),
                    output_file = paste0(i, ".pdf"))
}
Spencer Schien
Senior Manager of Data & Analytics
This is my bio. There are many like it, but this one is mine.